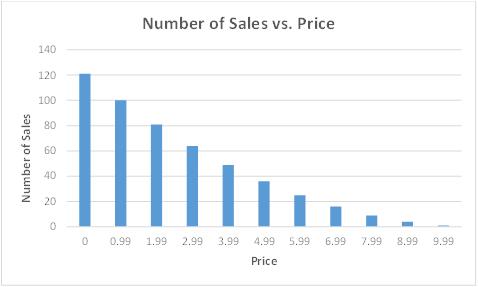
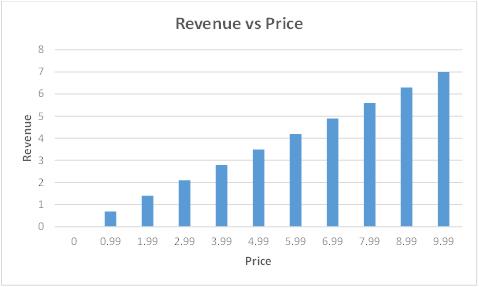
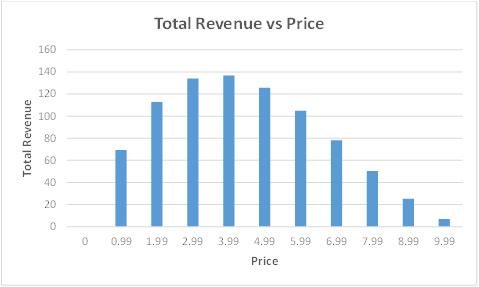
In the first part of this series, I discussed how the curve of Total Revenue vs Price is simple – low at both extremes with a single bump in the middle. In the second, I summarized qualitative wisdom about what that optimum value might be. This post reports what quantitative data I could find on the internet.
The data is meager. I found only two sources: Bookbub and Smashwords.
Bookbub
As many know, Bookbub is a promotion site for eBooks. For a fee, limited time bargains are email blasted to a very large list of subscribers (millions of them for certain genres). It cost a fee to have your book selected for a blast, and merely be willing to pay is not sufficient. The Bookbub curators choose the books that they judge to have high quality.
The email subscribers know this and appreciate being able to peruse a better subset of books out of the tidal wave of selections available.
I am not going to address the pros and cons of Bookbub here, only the pricing data that they have put online. At https://insights.bookbub.com/top-ebook-price-promotion-stats-you-need-to-know/ one can see the following bar graph.
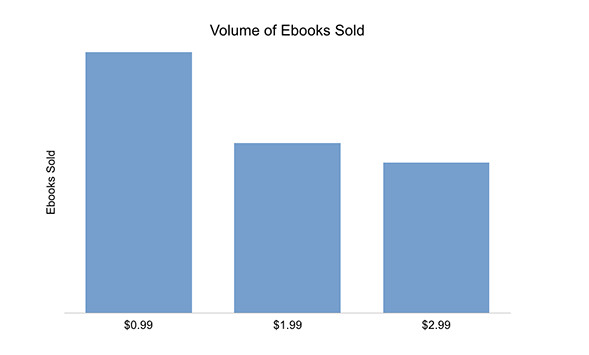
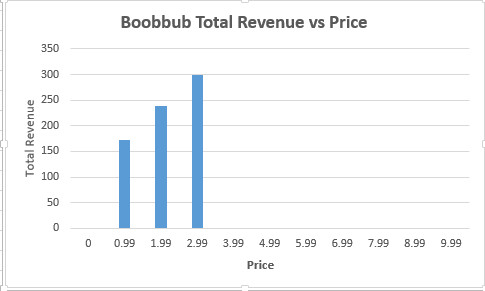
These data are an example of what I had been looking far. It gives the curve (well, three points on the curve) of number of sales as a function of price. As discussed in part one of this series, once you have this information, you easily can calculate the total revenue as a function of price. And from that see which price provides the greatest total revenue.
There is a statement on the Bookbub webpage text that sales for $0.99 are at least 75% more than those for $2.99. For the purposes of this post, I have disregarded the ‘at least’ and used 175 for the 0.99 data point (for when the 2.99 data point is 100). Nothing is said about the 1.99 price so I used a ruler on a screen shot to estimate that, if the 2.99 sales were 100, the 1.99 would be 120.
I have calculated the Bookbub total revenue in the format I used for the first post, Here it is.
For comparison, I also have copied the hypothetical example results here.
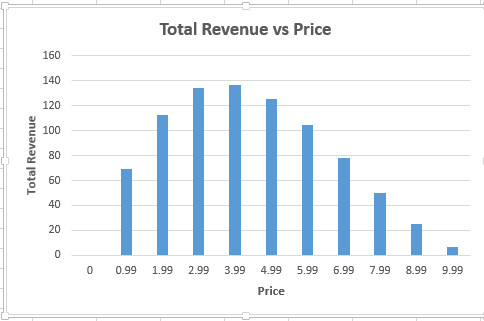
Not too shabby. The Bookbub data starts off low and rises as prices increase as expected. The graph mimics the lower portion of the hypothetical curve. Unfortunately with only three points, so we cannot see the peak in the middle with any certainty. The optimum value actually may be 2.99, but it also could be even higher. And at least one can get the warm feeling in the tummy that we are on the right track with the part one logic.
Caution! One cannot use the graph as shown above to make a profit decision for using Bookbub. The profit is the net revenue minus the fee you have to pay. This fee also depends on the price, and the higher the price, the greater it is. If the fees were included in the calculations, the price for the optimum profit easily could shift from that for optimum revenue.
Smashwords
Smashwords is a distributor of eBooks. They sell them to Amazon’s competitors. Barnes and Nobles, Apple, Kobo, libraries and others. Once a year they publish sales statistics for the past twelve months along with a lot of additional information. You can see the latest edition for 2017 at: http://blog.smashwords.com/2017/06/smashwords-survey-2017.html
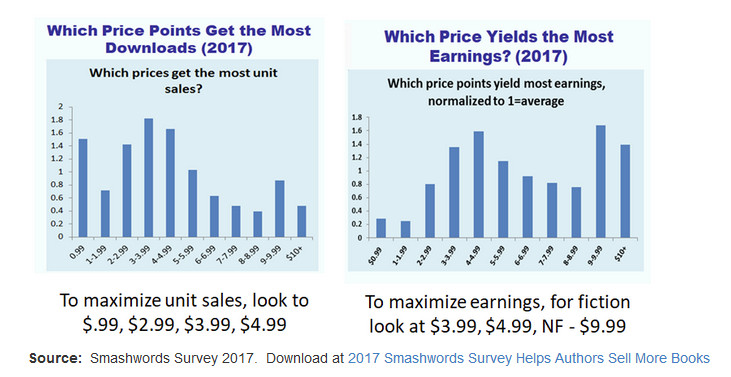
The graph of number of sales as a function of price is on the left above. The total revenue on the right. Let’s first examine the curve on the right.
Disregarding 9.99 for the moment, it looks like 4.99 is the optimum price. And, who knows, if Bookbub ran promotions up to 4.99 and beyond, their results might agree.
But there is a problem. Look at the graph on the left. In the real world, well, for the Smashwords world anyway, the number of books sold verses price does not decrease monotonically as price is increasing — the assumption used for the hypothetical result in part one of this series. For Smashwords, the data points from 3.99 to 8.99 behave as expected, but sales for 3.99 is greater than that for 0.99, 1.99, or 2.99! Perhaps this is due to the fact that books at those lower price points are more likely sold by Amazon and not Smashwords, but who knows?
And then there is another anomaly at the higher values – spikes at 9.99 and 10.99! Where do those come from? The results show that 9.99 gives the best results of all! The Smashwords text says that they might be due to bestselling authors who know the demand is high can take advantage of that in the marketplace.
This last comment suggests that maybe too much data has been conglomerated together. Maybe the Bookbub sales detract from those sold on Smashwords at low prices. Maybe the non-fiction books are what is pushing up the sales at 9.99 and 10.99.
One could say that, based on both datasets, 4.99 looks like an attractive candidate for the optimum price, but with no other sources of data, we can’t validate the conclusion. We can’t be sure.
A straw to grab
Okay, you might be saying. After wading through three posts, all I get to learn is that ‘We can’t be sure?’
Well, there is hope. There is one source available to each of us – our own book or books. Data on your own sales provide a sample not distorted by whatever is happening with other authors. Amazon makes it quite easy to change book prices at any time. One could run a series of experiments that are exactly tailored to your own situation. There would be no contamination.
Pick a book and systematically change its price say, once every month. Collect the statistics and keep track of the results. Compute the total revenue for each of your price points. When you find the best price, choose it as the one to use going forward. You can go back to sleeping better at night.
There are a few caveats of course. If you publish eBooks on both Amazon and Smashwords, you probably should confine the price change experiments to Amazon only – and always have them lower than their Smashwords counterparts. Otherwise, you might find that Amazon as automatically reduced your prices to match the competition, and you have no way to change them back quickly later.
Secondly, you do have to be selling enough so that the sales volumes you get are larger than the random fluctuations that will happen.
Other than that. Happy price optomizing!


