
For a consumer, the best price for an EBook is zero. Such a value is part of the checklist for a perfect product:
* Perfect
* Now
* Free
But what about the authors? We, too, want our works to be as perfect as they can. No flaws. No typos, no bad grammar, no prose too dense to wade through.
With the advent of the EBook and sites like Amazon and others, “now” is also pretty much realized as well.
But the price? Ah, that is more complicated.
Sure, we all want what we write to reach the greatest possible audience and to bask in the attention that we get as a result – the satisfaction of our stories being read. But there also is the little matter of putting food on the table. To be frank, most of us want to earn as much as we possibly can from our efforts at writing.
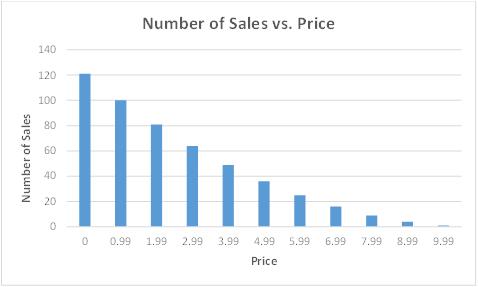
But at what price? There is little disagreement that, if we offer an EBook at no cost, the number of readers we reach is as large as it possibly can be. An idealized graph of the number ‘sold’ as a function of price looks somewhat like the following. It is the highest for zero cost and continually decreases for each increment in price thereafter.
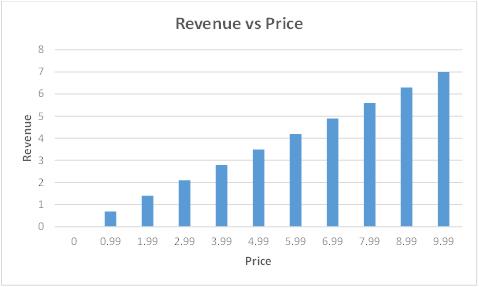
On the other hand, the more we charge per sale, the more revenue is earned with each book sold. The curve of revenue as a function of price is a no brainer. It looks like this — a straight line rising to the right. It can be calculated with certainty. For a vendor such as Amazon or Smashwords, the royalty rate is around 70% for a single book. One selling at $5.00 generates around $3.50 of income.
The graph for the total money earned is simply the product of these two curves – the number of books sold times the revenue earned per sale.
Even without knowing the exact details of the total revenue verses price curve, we can estimate what it has to look like. For low prices, the total revenue is relatively low. It has to be. The low price for each book sold drags down the total money earned. Likewise, for high prices, the number of sales is also low. The high price suppresses the number of books sold.
Okay, we have a curve that is low at both extremes. What else can we intuit? Well, the two curves that form the basis for the third do not have a lot of bumps and wiggles. This means that neither can their product. So, the revenue earned curve rises from a relatively low value on the left, reaches a peak, and then declines to the right. A single bump in the middle is the most it could have. The price that generates the most revenue lies somewhere between the two extremes at either end.
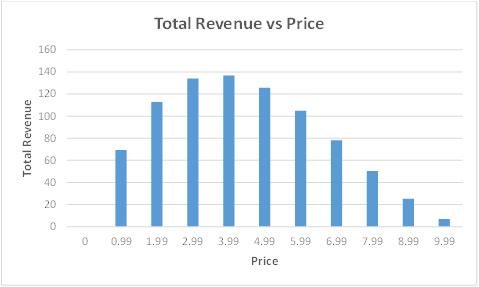
See, there is an optimal price. A sweet spot. One at which there are readers willing to pay and the author gets as much compensation as he can. (The graph shown here is merely an example – from a completely made up, imaginary number of sales verses price curve. Your actual mileage will differ.)
In real life there are many factors involved that determine the sales verses price curve. This means that the revenue verses price curve is not a single one that applies to all genres and authors – or to even all books by a single writer. But if we had an honest to goodness, real numbers for the sales verses price curve, we could then compute what the total revenue per price curve looks like, just like we did for the example.
The problem is: what does a real number of sales verses price curve look like?
Over the last year or so, I have scoured the internet looking for quantitative data that might help pin down more precisely the numbers that make up that curve. Is there an abundance of quantitative data our there for that? Ha, I wish!
My starting point was to look at qualitative advice offered on Goodreads and go on to other internet sources from there. Part 2 of this series of blog summarize what I found. Please stay tuned.