Supply chain management demonstration
Overview
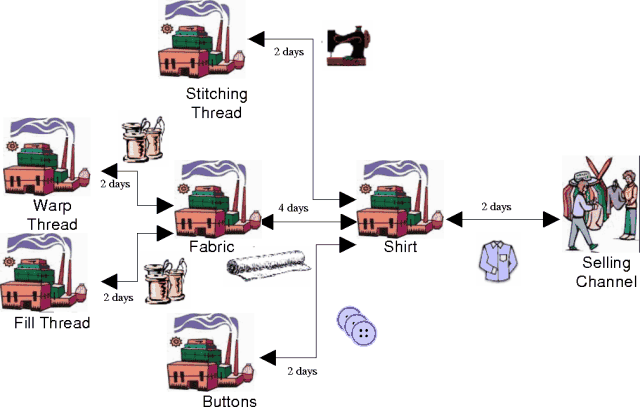
This demonstration illustrates how participants in a supply chain may coordinate information. Our simple, fictional supply chain has seven participants for making and selling a shirt:
- a retail store (the customer)
- a shirt maker
- a fabric maker
- a button maker
- a stitching thread maker (for sewing the cut fabric pieces into a shirt, and attaching buttons)
- a warp thread maker (the more visible, "foreground" thread in fabric)
- a fill thread maker (the less visible, "background" thread in fabric)

|
Our demonstration highlights using lightweight, reliable, modern technologies on the Internet to achieve coordination. Web pages are used to view and interact with the demonstration. The pieces would be embedded within the participants are for communication (within the enterprise and across the Internet to the other participants) and coordination (who to exchange information with, how the information and participants are structured).
Coordinating Demand
There are many, many kinds of information that can be coordinated across supply chains. Orders. Inventory. Available to promise. Defects. Return materials. Catalogs. Design. Etc.
For this demonstration we chose future demand. The demonstration starts with a sales forecast, estimated by the customer for the shirt maker. How many shirts from that maker will this customer sell?
Based on estimated sales the maker can estimate how much fabric, thread, and buttons are needed, and when. This is the estimated future demand on those supplies by the maker. When estimated and believed valid, the maker passes those estimates to the fabric maker, the button maker, and the stitching thread maker.
The fabric maker in turn estimates the demand for warp and fill threads.
This demand factors into the sales estimate for each of those three makers.
|
Extending the Demonstration
We chose apparel manufacture as an example. This solution can easily accommodate other types of chains.
Clearly this demonstration is simple, to help focus on the technique. A more complete supply chain includes transportation. The estimated demand would be propagated to appropriate transportation participants, to help them plan their capacity.
A more complete supply chain has multiple customers for each supplier. The estimated demand for fabric from this shirt maker would be combined with the estimated demand from other apparel companies, leading to a total estimate. Demand computation in many companies is done in an MRP or ERP or SCM application. In others it is done in a spreadsheet, or perhaps even on paper. In our demonstration the messages we exchange with the web page to refine demand can easily be integrated in a spreadsheet, or with a database.
The demand estimates coming into a manufacturer would be input to the applications. The applications would, on some interval, (re)estimate the demand on suppliers. This estimate can be a complex computation that incorporates inventory, use of resources, capacity, and other factors.
An important point to understand is these extensions do not change the techniques demonstration, but rather scale them.
What is Demand Good For?
If you are a company making a product, knowing the future demand gives you an edge. You know the capacity you will need, allowing you to acquire extra capacity, or sell excess capacity. Since selling and buying capacity takes time, knowing the demand early can make the difference in getting good deals.
Better demand knowledge supports efficient production planning. For example, if shutting down the production facility for a time can save costs, knowing demand provides the data necessary to figure out when and for how long.
This coordination with suppliers takes effort. Why not just accept the information, but not propagate it? Many good reasons exist to provide demand estimates to suppliers. They can plan and produce more efficiently, leading to lower pricing and faster responses to changes in demand. There is other information (e.g., available to promise) that takes effort from the suppliers to provide to you, their customer. The exchange of different information is good business.
These are examples. In general, foreknowledge supports better planning, greater efficiency, and better relationships with customers and suppliers.
The Demonstration
Note: This demonstration best viewed on screen sizes 1280x1024, or larger. Also, due to the nature of the javascript that has been employed, browser support of DOM 1.0 is required. Thus you need to use browsers like IE 5 or later, Netscape 6 or later, Mozilla 1.0rc1 or later, or Gnome galeon 1.2.1 or later to be able to run the demo. Also note that at this point Netscape 6 doesn't work well with Flash, so the monitor page will likely not animate for you if you use Netscape.
The demonstration appears in five windows. Start with two:
- Monitor (uses Flash)
- Sales Forecast Entry
Resize and position these new windows according to your monitor screen. The Monitor page depicts the chain, and animates the demand message flow when it occurs. (We slow this down for visibility reasons. Trust us, the actual messages in the background between the nodes are very fast - milliseconds).

|
The Sales Forecast Entry page allows you - acting as the retailer - to enter a sales forecast. Let's do just that. In this page enter a quantity of 100 for 1/04/01 and 120 for 1/05/01, and then click Set Retailer Demand. The Monitor shows the demand propagating from customer to shirt maker, and then on to the various suppliers. Something is moving from participant to participant.
Ah, but what is really being passed? Bring up a third page:

|
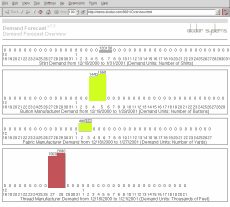
This page presents an overview of the demand for shirts (the values entered before should appear here) and the demand for the shirt suppliers. Note the quantities and dates are different for the suppliers. This is because the shirt manufacturer requires different amounts of each material to make a shirt, and different lead times to receive the material to account for the manufacturing process.
For example, for this shirt style, it takes 12 buttons to make one shirt, and buttons must be received two (2) days before the shirt is shipped. Thus the 100 shirts to be shipped by maker to arrive at the customer on 1/04/01 requires the button maker to deliver 1200 buttons to the shirt maker by 1/02/01.
In the Sales Forecast Entry page enter a quantity of 140 for 1/06/01. When you click Set Retailer Demand now not only will the Monitor page illustrate demand propagation, but also the Demand Forecast Overview page will show the actual demand updates. Again, we slowed the messaging for ease of viewing.
Underlying this demonstration each node (each icon in the Monitor; each participant in the chain) has a communication router, a demand module, and local web pages. These local pages allow personnel in the participating organization to configure their local demand module. Items to configure include:
- products this participant produces
- customers for product, including their connection info
- material used to product each product
- suppliers for the material, including their connection info
- the amount and units of material needed for each unit produced, and lead time (in days)
- how customer demand is handled, and where supplier demand is acquired

|
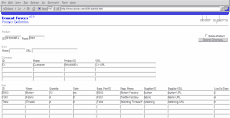
Select the shirt entry on this Product Definition page and click Submit. The configuration for the shirt we have demonstrated is presented. Note the user field and URL are blank. When blank, the demand is propagated automatically, as we have seen. The sales forecast is propagated through the chain. In most chains the full automation in this manner will be unusual. Instead a human or application will provide the supplier demand based on the customer demand, and other relevant local parameters.
To highlight this, enter "Me" into the User Name field on the Product Definition page, and click Submit Changes. Now this shirt maker will require manual review, by Me, of supplier demand before it is passed on. To see this, bring up the fifth (and last) page:

|
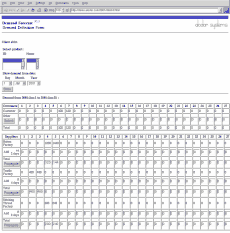
Return to the Sales Forecast Entry page and enter a quantity of 90 for 1/07/01, and hen click Set Retailer Demand. The Monitor and Overview pages show the demand propagating from customer to shirt maker. And it stops. Why? Because the shirt maker now requires Me to get involved. Return to the Demand Definition Form. Note the data for the customer, and the demand for each supplier. Let's say the data is mostly OK, but we want more buttons to increase our inventory to safety stock level. Under Suppliers, for Buttons, modify 1200 to 2000 by entering 800 in the Add row for 1/02/01 (the column headed 2), and then click on propagate. The value updates on this page, and the communication is shown on the Monitor and Overview pages.
Similar actions can be performed for Fabric and Stitching Thread. Or the computed demand can be sent to suppliers as-is. With simple operations we have received demand from our customer, estimated demand on suppliers, manually reviewed, modified as desired, and sent.
This concludes this demonstration. Feel free to try other options. Close the five pages when done.
To Explore Further
If would like to learn more about this solution, do not hesitate to contact us. The underlying communication technology, including that used for the real-time updates of the web pages, comes from KnowNow, Inc.